How Uber's automated dependency analysis reduces cascade failures in service meshes
Uber replaces sampling-based tracing with middleware metrics to classify every RPC dependency as fail-close, fail-open or unknown, then drives circuit-breaker config from those labels.
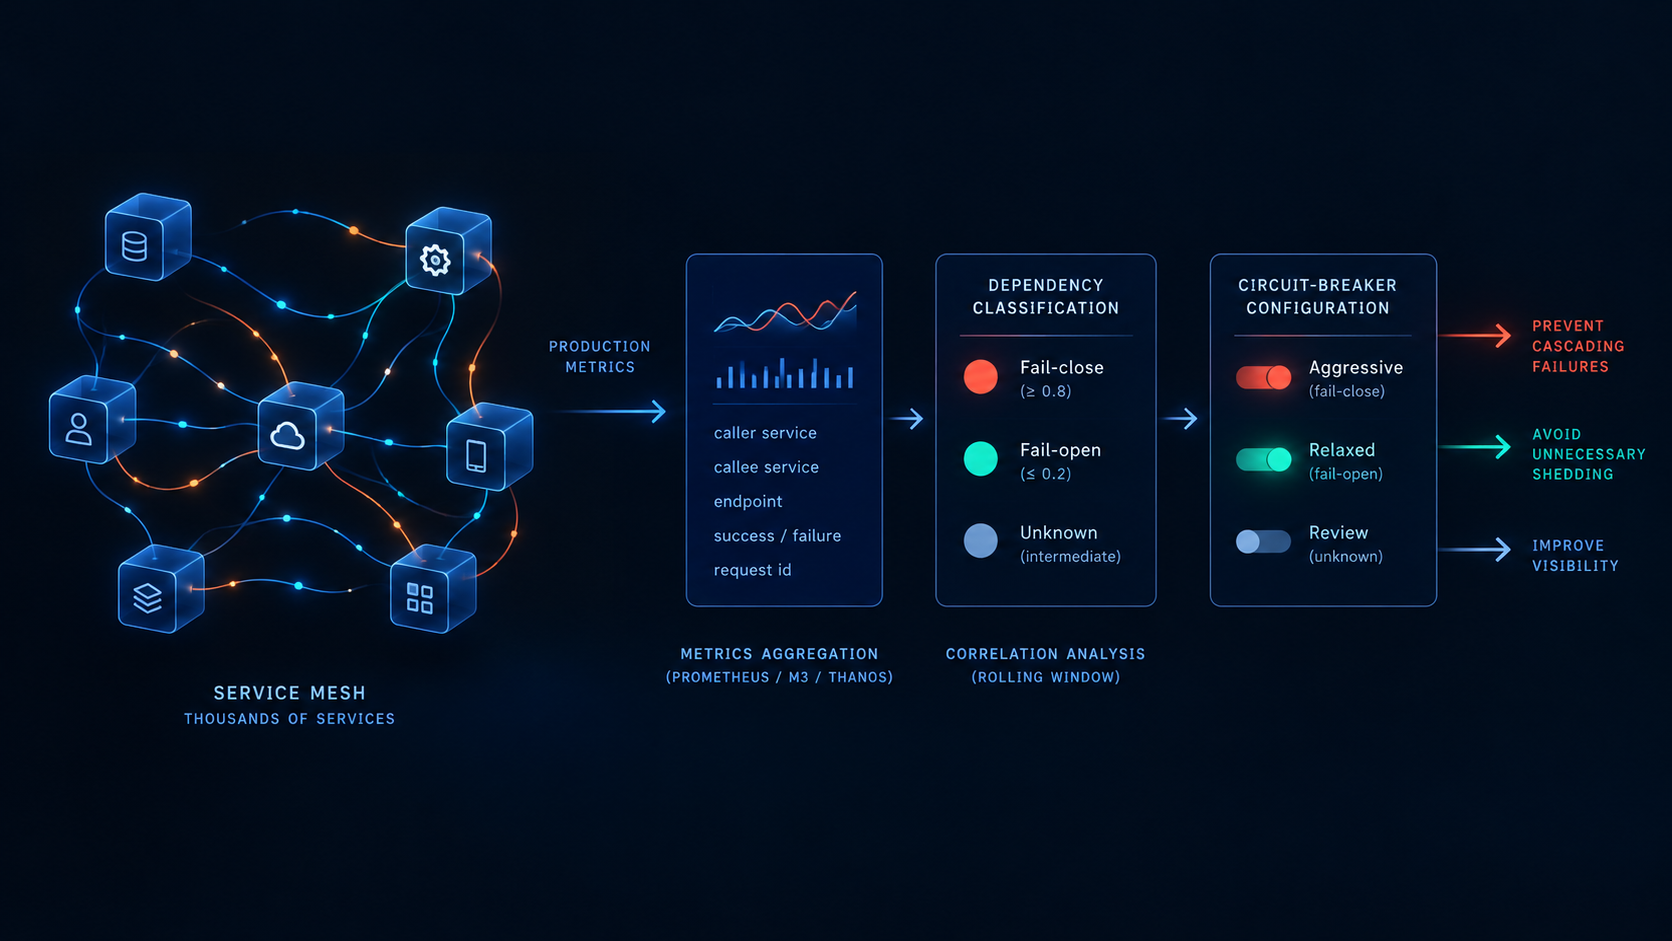
Uber has built an automated system that classifies every RPC dependency in its service mesh as fail-close, fail-open or unknown, then drives circuit-breaker configuration from those classifications. The approach replaces slow, sampling-based tracing with middleware metrics that capture production failures at full volume, giving platform teams a practical path from reactive incident response to proactive mesh hardening.
Why sampling-based tracing misses the failures that matter
In a mesh handling thousands of services, more than 99.9% of requests complete without errors. At a 0.01% trace sampling rate, an erroneous request has a one-in-10-million chance of being captured. Uber calculated that at 500 requests per second, capturing a single failed request could take over five and a half hours. Distributed tracing pipelines built with OpenTelemetry rely on tail sampling to retain error traces, but the overhead of storing and evaluating individual traces makes them too slow for rare, high-impact failures. Uber's engineers — Deepanshu Mehndiratta, Alok Srivastava and Shivam Jindal — describe the trade-off as choosing faster feedback over per-request visibility. The full analysis is described in Uber's own engineering post and summarised by InfoQ.
The key lesson for platform teams is that observability should help drive operational decisions, not just explain incidents after they happen. Dependency failure classification offers a practical way to connect production behaviour with circuit-breaker policies, but correlation thresholds should be validated against real traffic patterns before triggering automated changes. Start with a small set of critical service dependencies, account for retries and traffic variability, and keep unknown classifications visible for review. The goal is not to eliminate distributed tracing, but to complement it with lightweight, continuous signals that make service meshes more resilient.
Classifying dependencies from production metrics
Uber routes service-to-service traffic through Muttley, an on-host proxy for routing and telemetry. Muttley lacks caller endpoint context, so the classification logic lives in YARPC, Uber's RPC framework for Go and Java. Inbound middleware generates a request ID and records the caller service and endpoint in an in-memory RequestTracker. The ID propagates through Go's context, allowing outbound middleware to record the downstream service, endpoint and call result. At request completion, middleware emits metrics capturing caller and callee failure states.
From these metrics Uber calculates a failure correlation probability for each caller–callee pair. Values ≥0.8 are classified as fail-close — the callee's failure consistently causes the caller to fail. Values ≤0.2 are fail-open — the callee can fail without affecting the caller. Intermediate values remain unknown. Retries are handled separately so they are not treated as independent dependencies. The result is a dependency catalogue that covers critical APIs and indexes most fail-close anomalies across the mesh.
Driving circuit-breaker configuration from classification
The classification feeds directly into platform tooling. Fail-close dependencies receive aggressive circuit-breaker thresholds and shorter timeout budgets, because their failure propagates. Fail-open dependencies get relaxed thresholds, avoiding unnecessary shedding of traffic that the caller can tolerate. Unknown dependencies are flagged for manual review or additional instrumentation. By automating this loop, Uber turns a previously manual, incident-driven tuning process into a continuous, data-driven one.
What platform teams can adopt today
The same pattern works without Uber's internal frameworks. Teams running Envoy, Linkerd or Istio can:
- Emit caller and callee outcome metrics from sidecar or library middleware — request ID, caller service, callee service, endpoint, success or failure.
- Aggregate those metrics in a time-series store (Prometheus, Thanos, M3) and compute correlation probabilities on a rolling window.
- Apply the ≥0.8 / ≤0.2 thresholds to label dependencies, then feed the labels into circuit-breaker configuration via GitOps or a control-plane API.
- Treat retries as a single logical attempt to avoid double-counting.
The data pipeline is deliberately simple: middleware metrics replace trace storage, correlation math replaces trace querying, and classification replaces manual runbook updates. The cost is a small increase in metric cardinality; the gain is mesh-wide visibility into failure propagation that tracing cannot provide at scale.
What to do next
Start by instrumenting one high-traffic service pair with caller/callee outcome metrics and compute the correlation probability for a week. If the classification is stable, extend coverage service by service and wire the labels into your circuit-breaker policy. Teams that need help building the instrumentation layer or the feedback loop into their existing mesh can look at our systems integration work — we connect systems that were never meant to interoperate and automate the processes across them, engineered to tolerate failure so outages never leave divergent records.
Frequently asked questions
Why does sampling-based tracing miss important failures in a service mesh?
At a 0.01% trace sampling rate, an erroneous request has a one-in-10-million chance of being captured. With 500 requests per second, capturing a single failed request could take over five and a half hours.
How does Uber classify RPC dependencies as fail-close or fail-open?
Middleware in YARPC emits caller and callee outcome metrics for every request. A failure correlation probability is computed for each caller–callee pair: ≥0.8 is fail-close, ≤0.2 is fail-open, intermediate values are unknown.
What circuit-breaker configuration does each classification receive?
Fail-close dependencies get aggressive thresholds and shorter timeouts. Fail-open dependencies get relaxed thresholds. Unknown dependencies are flagged for manual review or additional instrumentation.
Can this approach work without Uber's internal frameworks?
Yes. Teams using Envoy, Linkerd or Istio can emit caller/callee outcome metrics from sidecar or library middleware, aggregate in Prometheus or Thanos, compute correlation on a rolling window, and feed labels into circuit-breaker config via GitOps or a control-plane API.
How are retries handled in the correlation calculation?
Retries are treated as a single logical attempt so they are not counted as independent dependencies.